Sunday, December 7, 2014

26-Nov-2014: Period of Oscillation of semi-circle

Purpose:
The purpose of this lab is to determine the period of oscillation of a semi circle when the pivot point is located in the center on its flat side and on its round side.

Apparatus:
Our apparatus consisted of a semi circle cut from a Styrofoam board suspended from a bar, tape, and a photo gate. The experiment would be conducted twice, changing the pivot points for each part.


Experiment:
Before conducting the actual experiment we need to make predictions of the outcome. In order to do this we need to use various concept that we've used in the past which include: Moments of Inertia, the parallel axis theorem, and simple harmonic motion.

Our first step was to find the moment of inertia of the semi circle. In order to find its moment of inertia we must use the parallel axis theorem. We derived the moment of inertia as follows:

Ishape = Icenter mass + MR^2

After integrating our function we find that the moments of inertia are:

Flat side: I = (4/3π)MR^2

Round side: I = π M (R- (4/3)R)^2

After finding the moment we can proceed to find the angular speed of the oscillating semi circle at any given time using:

Torque = Inertia * angular acceleration = Force * radius

[ (1/2) MR^2 α = mass * gravity * radius cos θ

α = ω / t

ω^2 = (2*g*r) / (R^2)

Period = 2π / ω

Here are our calculations:


 Flat side: Period prediction = 0.857 seconds
Experimental Period = 0.843 seconds

Round side: Period prediction = 0.830 seconds
Experimental Period = 0.821

Conclusion:
When changing the pivot of our semi circle we see a slight change in its oscillation. This caused  because of the motion of the center mass.


Saturday, December 6, 2014

24-Nov-2014: Mass-Spring Oscillations

Purpose:
The purpose of this lab was to find the relationship between mass and spring constant force in simple harmonic motion.

Apparatus:
The apparatus used in this experiment consisted of a suspended spring, a motion detector, as well as various masses which would be attached to the spring. Each lab group possessed a different spring, varying in mass and spring constant force.


Experiment:
Our first focus was to find the constant values of the spring we were assigned with, the values being mass and spring constant. The mass of the spring was found relatively easy with a scale. The value of the mass was recorded at 28.1 g. Next was the value for the spring constant which was found by measuring the distance the spring stretched when different masses were hung onto it. This was done using logger pro by find the equilibrium position when the spring was suspended with the 100 gram hook. As a result we recorded the average value of the spring constant as approximately 26.0 N/m.

Our next objective was to find the period of oscillation of our spring without any mass attached to it (only the 100 gram hook). Once again using logger pro we found that the period of oscillation was 0.42 seconds.


In order to do the second part of the experiment we needed other values for periods of oscillation and spring constants. This was done by comparing data with other groups in class.


Our final instructions were to construct two graphs, one for period vs time graph for our spring and the other for period vs. spring constant for a constant mass which would include the values from other groups.

The first graph required us to find the period of oscillation for three other mass in order to depict the change of the period with respect to amount of hanging mass.


After constructing the graphs above and finding the respective periods of oscillation the graph below was able to be generated.


The second graph merely required the data shared by the other groups.


Conclusion:
The graphs depict that a relationship exists between the mass of the spring, the spring constant, and its harmonic motion. As the mass increases so does the period of oscillation although being slightly. In terms of the spring constant, the greater its value the smaller the period of oscillation.This can also be proven with the equation for calculated period which states:

Period = 2(pi) (mass / spring constant)^(1/2)

17-Nov-2014: Angular Momentum with Collision

Purpose:
Find the relationship between angular moment and height in an inelastic collision.

Apparatus:
The system that the experiment was conducted on consisted of a meter stick with a hole drilled on one of its far ends. The meter stick was then suspended by its hole allowing it to oscillate.


At the meter stick's lowest point was located a small piece of clay. When the meter stick where lift at any angle it would collide with the clay in an inelastic collision.


 A camera was set in a position to record the movement of the meter stick before and after the collision.


Experiment:
To begin the experiment, we needed to make a prediction for the max height of the clay after it collided with the bar, releasing it 90 degrees from the clay's position. In order to do this we need to derive an expression for the height of clay at each time interval and measure the mass of the clay and meter stick. This is done using the equation conservation of angular momentum:

Inertiabefore * angular velocitybefore = Inertiaafter * angular velocityafter

Moment of Inertia of bar on its end = (1/3) MR^2
Moment of Inertia of a particle = MR^2


The conservation of angular momentum gives us a value for the angular velocity when the meter stick collides with the clay. This value can be used in the conservation of energy where we would have rotational kinetic energy when the clay and meter stick collide and gravitation potential energy when the clay reaches its maximum height. The conservation of energy then gives us an angle value. With this angle, 59.56 degrees, we are able to find the max height of the clay. We can determine that the meter stick produces a right triangle when its not positioned at rest meaning that we can subtract the length of the meter stick to the side adjacent to the angle we predicted meaning:

Height = Length - Length * cos (angle)

Height = 1 - cos (59.56)

Height = 0.49 meters

Now that we have a theoretical value for the max height of the clay after it collides with the meter stick we can find the actual height.

By connecting our camera to a laptop and opening logger pro we are able to place points on the position of the meter stick as it collides with the clay and reaches its max height constructing these graphs:

Unfortunately this height is not correct since the clay is slightly elevated but it is quickly fixed by subtracting the elevation with the max height recorded by the camera, giving us the value:

Experimental Maximum Height = 0.284 meters

Conclusion:
Many questions came to mind on why the theoretical value and experimental value of the height were so different. We checked all of our values and made sure they were correct. Finally we came to the conclusion that the meter stick experienced friction on its pivot point as well as air resistance as it moved.

Friday, December 5, 2014

5-Nov-2014: Moment of Inertia: frictional torque, acceleration, and time

Purpose:
The purpose of the lab was to find the relationship between the moment of inertia, frictional torque, and acceleration in a disk and cylindrical system.


Apparatus:
This lab contains two different apparatuses for two different experiments. The first consisted of a metal disk with two cylinders attached to each side as seen below. The disk and cylinders spin freely. A camera is setup in a position to clearly record the movement of the system when in motion.


The second apparatus consists of the last apparatus with the addition of a ramp and a cart. The cart is connected to the system with string and causes it to spin as it moves down the ramp.


Experiment:
Our first objective is to measure the dimensions and mass of our apparatus using various calipers.

Disk thickness = 14.7 millimeters
Disk diameter = 20.05 centimeters
Cylinder thickness = 5.25 centimeters
Cylinder diameter = 31 millimeters
Mass of system = 4.615 kilograms

The next step is to find the moment of inertia of the system. In order to achieve this the moment of inertia of the disk and two cylinders must be added together. Since both are disks in technicality we will use the equation for the moment of inertia of a disk [(1/2) MR^2] to find their values.

Idisk = (1/2) Mass * Radius^2

Icylinder = (1/2) * (0.3364 kg) * (0.031 m)^2
Icylinder = 4.04 x 10^-5

Icylinder = (1/2) * (3.94 kg) * (0.10025 m)^2
Icylinder = 1.979 x 10^-2

Our next goal is to find the frictional torque of the system when it is being spun. In order to do this we must find the angular deceleration of the apparatus using a camera. By connecting the camera to a laptop and opening logger pro we are able to place points on the spinning system as it slows down. Once enough points are generated, such that its deceleration can be fairly accurate, we can construct a position vs time graph of the spinning system.


By taking a linear fit of the graph we gain an estimated value of the angular deceleration which in this case is 0.08175 rad/s^2. Using this value and the value of our systems inertia calculated in the previous step we can find the value of the frictional torque using the equation:

Torque = Inertia * angular acceleration

Torque = [(4.04 10^-5) + (1.979 10^-2)] * -0.08175 rad/s^2

Frictional torque = -0.0161 Newtons

This concludes the first experiment.

The next experiment involves our second apparatus which includes the system of the previous experiment with the addition of the ramp, string, and cart.

Our first objective is to find the time it would take the cart to travel down the ramp if it were connected to the apparatus. The dimensions and mass of the cart and ramp are given as 500 gram cart, 1 meter long track, and 40 degree angle between the track and the ground. Beginning with a free body diagram and by using our known equations for rotational movement and their respective values, we calculated the estimated time and acceleration as seen below:


The values calculate were as follows:

Acceleration = 0.0254 m/s
Time = 8.87 s

Now that a prediction has been made we conduct the experiment to compare the theoretical value with the experimental value to conclude the experiment. The values for time that we recorded were as follows:

Time 1 = 8.95 s
Time 2 = 9.05 s
Time 3 = 9.52 s

Conclusion:
Our values for the actual times and theoretical value slightly very mainly because the human eye (our eyes) cannot observe the exact time the cart begins its decent. Overall the experiment was a success.

3-Nov-2014: Angular acceleration

Purpose:
The purpose of this lab is to observe the effects of various changes to the apparatus and how it effects the angular acceleration of the system. These observations would help us find moments of inertia later on.

Apparatus:
The apparatus consists of an elaborate mechanism that consisted of 2 steel cylinders, 1 aluminum cylinder, an air hose, string, a hanging mass, a pulley, a torque pulley, a pin to hold the cylinders together, and a photo gate located on the side of the brown box seen on the top right hand corner of the apparatus next to the cylinders. The cylinders (a combination of 2 steel or 1 steel, 1 aluminum) would be placed next to the brown photo gate box and held together with a pin as seen below. Between the pin and the cylinders would be a torque pulley that will be connected to a string with a mass at its opposite end. As the system begins to spin the mass would move upward or downward depending the direction of the spin of the cylinder(s). The cylinders contain white and black on their side which allow for the photo gate to capture and collect the angular speed of the spinning cylinder(s).

The system would be connected to an air source via air hose. As the air was increase the cylinders would spin together or the top cylinder would spin by itself if the air was allowed to escape through the secondary hose.


Experiment:
Six different trials were conducted to observe the difference in angular accelerations when different characteristics of the system were changed which included: amount of hanging mass, size of torque pulley, mass of the rotating cylinders, and whether both cylinders were spinning. The six different trials were preformed as specified on the lab handout and the data was recorded using logger pro.


Conclusion:
By analyzing the data we can see that various aspects of the system effect the angular acceleration of the cylinder(s). The first is the amount of hanging mass attached to the string. As seen in the data, the angular acceleration increases by approximately 0.6 radians per second each time the hanging mass is increased by the amount of its original. The next factor that effects the angular acceleration is the radius of the torque pulley. Changing the torque pulley from a small radius to a larger one significantly increases the angular acceleration almost doubling the value. The mass of the spinning cylinder also greatly effects the angular acceleration, meaning a light mass generates a greater angular acceleration. Finally, the amount of cylinders spinning effects the angular acceleration as well. When both of the cylinders spin the angular acceleration drastically decreases. By observing these changes we can conclude that the value of angular acceleration is directly effected by mass of the spinning object, mass of the attached object, radius of the spinning object and radius of the torque pulley.

6-Oct-2014: Coservation of energy of hanging mass on a spring

Purpose:
The purpose of the experiment conducted was to verify that energy is conserved in a mass spring system.

Apparatus:
The apparatus that was setup was a column with a force sensor attached to its end. Connected to the force sensor was a spring that suspended a mass at its end. A motion detector was placed directly below the spring to record its movement as see below:


Experiment:
We were asked to measure 5 pieces of data to help us prove the conservation of energy in the apparatus which are as follows:

1) KE of the mass
2) GPE of mass
3) Elastic PE in spring
4) GPE of spring
5) KE of spring

1) KE of mass

In order to find the kinetic energy of the mass we needed to find the velocity of the mass as it oscillated up and down the spring. In order to find the velocity we conducted the experiment and used the motion detector to find the velocity of the mass at small time intervals. By creating a new calculated column and using the equation for kinetic energy we typed the equation:

KE mass = (1/2) (mass) (velocity at any given time)^2

KE = (1/2) (0.05kg) V(t)^2

2) GPE of mass

Just as the kinetic energy of the mass we used the motion detector only to this time record the height of the mass as it oscillated. As the mass moved upward and downward the motion detector recorded the distance from itself to the mass. By finding the various heights we were able to create values for the gravitational potential energy of the mass as follows:

GPE mass = (mass)(gravitational acceleration)(height at time)

GPE = (0.05kg)(9.8m/s^2) h(t)

3) Elastic PE in spring

Once again using the motion detector we recorded the distance the spring extended or compressed. Before pulling the mass downward to cause the oscillation we had to calibrate the motion detector to zero when the mass hung on the spring at rest. Once done, we conducted the experiment and substituted the values found by the motion detector into the elastic potential energy equation:

PE elastic = (1/2) (spring constant) (distance spring moved)^2

In order to find the value of the spring constant we placed a mass of known value and hung it on the spring recording the distance the spring stretched. By substituting the values recorded in the equation for spring force we determine the following:

Force of spring = spring constant * distance 

(0.4 kg) (9.8 m/s^2) = spring constant (0.17 m)

spring constant = 23 kg/s^2

 Using this value we are able to substitute it into the gravitational potential energy equation:

PE = (1/2) (23 kg/s^2) (y(t))^2

4) GPE of spring and KE of Spring


Sunday, November 9, 2014

27-Oct_2014: Conservation of Momentum with collisons

Purpose:
The purpose of this lab was to verify the conservation of momentum in a two dimensional collision by using to equal masses and two different masses.

Apparatus:
The apparatus provided featured a column with a camera attached to the top connected to a laptop. Below it stood a glass table where the collision would take place. Camera captured the collisions as the balls began to move until the wanted data was collected and displayed on logger pro on the laptop. The first collision required two equal mass steel balls while the second collision consisted of one steel ball and a marble of different mass.


Experiment:
Starting with the equal mass collision we placed one of the steel balls in the center of the glass table so that it remained stationary until impact. Once done we took the second steel ball and pushed it toward the stationary ball diagonally creating an impact where the balls resulted in moving in significantly different directions all while recording the collision with the camera placed on the column. Once the video was recorded we saved it on a flash drive to further analyze it and allow our fellow classmates to use the apparatus.

Continuing onto the different mass collision we placed the marble of lesser mass in the center of the glass table so that it remained stationary just as the other ball in the first part of the experiment. Follow the same steps before we took the heavier steel ball and pushed it diagonally towards the stationary marble. Once again we took the recorded video and saved it onto a flash drive for further observation.

After collecting the video recordings we continued to analyze the videos using logger pro by establishing an axis of movement, plotting the position points, and creating a reference distance.
After using the features we were able to generate graphs for the position vs time of the balls as they moved across the glass table.


By taking a linear fit for each position vs time data set, we are able to find the average velocity of each ball before and after the collision in the x and y directions.

Using the velocities recorded by logger pro, the values for momentum of each axis can be solved for using the "Calculated column" tool in logger pro using the definition of momentum:

momentum = mass * velocity

Using all the data up to this point we create the data table shown below:


Further analyzing the total momentum for both experiments we are give the momentum vs time graphs for both the x and y direction.


The graphs appear to be consistent with few dips, meaning that the momentum is conserved throughout the experiment.

Conclusion:
I believe the experiment was successful in proving the conservation of momentum despite the small concavity depicted in  the graphs of momentum. The factor that effected this result consists of human error with inconsistent plotting of point on the collision video as well as the friction experienced by the balls with the glass table.

Saturday, November 8, 2014

20-Oct-2014: Conservation of energy with Elastic and Inelastic cart collsions

Purpose:
The purpose of this lab was to determine the impulse of a cart when it experiences inelastic and elastic collisions.

Apparatus:
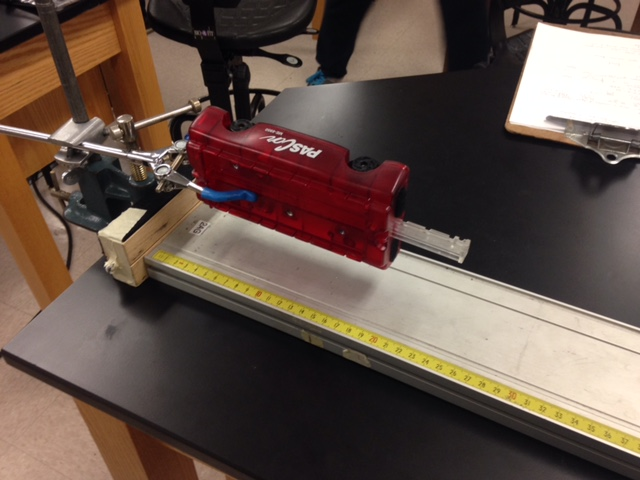
The apparatus required three setups and consisted of a cart track, two carts, a force sensor, a motion sensor, clay, and a nail. All the setups required for one cart to be on the track with the force sensor attached to the cart and a motion sensor on the opposing side of the collision as seen below:


The first setup specified that the cart would complete an elastic collision and would collide into another cart while the force sensor recorded the force exerted in the collision and the motion recorded its position as seen below:


The second would require the same actions only with additional mass attached to the colliding cart

The final setup would substitute the stationary cart with a clump of clay which caused the colliding cart to experience an inelastic collision. A nail would be attached to the force sensor in order for the cart to stop when becoming intact with the clay:


Experiment:
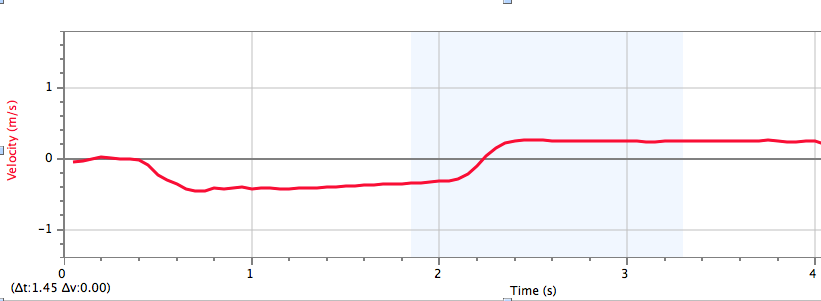
Before performing any of the experiments we first setup the sensors using logger pro on the laptop. Once the sensors were set we proceed to conduct the experiment for the first setup. Here we pushed the cart towards the opposing cart and recorded its velocity, force experienced, and position generating the graph below:


Before analyzing the force vs time we recorded the mass of the cart and determined the change in velocity in order to compare our calculations of the change in momentum with the actual value of the impulse.

momentum = Mass*(velocity final - velocity initial)
ΔP = (0.39 kg)*(-0.406 m/s - 0.452 m/s)
ΔP = -0.3346 Ns

As you can see the cart experienced a spike in force when the velocity changed to negative where the cart impacted the other. By finding the area of the spike in the Force vs. Time graph we determined the impulse that occurred in the elastic collision.

Impulse = -0.3566 Ns

The values of impulse and change in momentum are almost identical.

The experiment for the second experiment was exactly the same with the only change of adding mass the cart. After the experiment once again logger pro generated graphs for force, velocity, and position:


ΔP = (0.89 kg)*(-0.193 m/s - 0.299 m/s)
ΔP = -0.4378 Ns

Impulse = -0.4644

Once again the values of momentum and impulse are similar

Although the velocity of the cart in this experiment is slightly smaller than that of the first experiment the impulse is greater meaning that both mass and velocity have an effect on the impulse.

The final experiment consisted of the same step only substituting the stationary cart with a clump clay resulting in the graph below:


ΔP = (0.39 kg)*(0 m/s - 0.487 m/s)
ΔP = -0.1928 Ns

Impulse = -0.2005

In an inelastic we can see that the values of impulse are much smaller although the velocity is greater.

Conclusion:
After conducting the experiment we can verify that mass and velocity play a big role in determining the value for the change of momentum in an object as well as the force and time that effect impulse.

13-Oct-2014: Potential Energy of Air cart and magnet

Purpose:
The purpose of this lab was to find a power fit function for the potential energy of an air track magnet and verifying conservation of energy.

Apparatus:
The apparatus consisted of an air track with a magnet attached to its end, an air cart with a magnet attached to the end of the cart, a motion sensor and an air generator. The air generator would circulate air through the air track that similar to a hockey table creating a nearly friction less surface. Wooden blocks and angle measure were also used to raise one side of the air track and determine the angle generated.


Experiment:
Once the apparatus was setup we began to elevate the air track opposite of the magnet side with the wooden blocks. We turned on the air generator causing the cart to move downward toward the magnet and stopping due to the opposing magnetic poles of the cart magnet and track magnet. Once the cart came to a complete stop we measured the distance between the cart and the magnet and measured the angle generating this data sheet:


The next step required us to find the force of gravity acting upon the cart for each angle. In order to find these values we used:

Force = mass * gravity * sin (angle)

After finding the values of the forces we opened logger pro on the laptop and plotted the values on a Force vs. Separation distance graph and created a power fit in order to find the force function and the potential energy of the magnet. As a result the graph below was produced:

Using the values specified by the graph the equation for the force of the magnet was concluded to be:

F(r) = Ar^B
F(r) = (5.57 x 10^-4) * r ^ (-1.64)

By taking the negative integral of the force with respect to the separation distance (r) we calculate the function for the potential energy of the magnet.

U(r) = (8.62 x 10^-4) * r ^ (-0.64)

Now that the potential energy was found we continue to the second part of the experiment which is calculating the kinetic energy.

Returning to the air track, we conduct the second part of the experiment by setting up the motion detector and pushing the air track toward the magnet this time on a completely leveled track. The motion detector records the velocity and position of the cart as seen in the graphs below:


Using the values of the velocity graph we can create a kinetic energy vs time graph using the "New Calculated Column" tool on logger pro resulting in:


The lowest point on the graph, or where the kinetic energy is zero, is where the air cart is closest to the magnet.

To prove there is conservation of energy we must add the kinetic and potential energy and they must construct a somewhat horizontal line on a graph


As a result of adding the potential and kinetic energy we generate the graph above.

Conclusion:
Although the total energy graph does not depict a horizontal or consistent line there are various factors that effected the experiment. The air track is not completely friction less causing the decrease in energy as seen in the graph. The graph experiences a major dip when it reaches the magnet but it can be concluded that it is caused by our potential energy function which is not exact since the values are estimated to the thousandths. Once these slight margins of error are dismissed it can be conclude that conservation of energy indeed is verified.