The purpose of this lab was to find a power fit function for the potential energy of an air track magnet and verifying conservation of energy.
Apparatus:
The apparatus consisted of an air track with a magnet attached to its end, an air cart with a magnet attached to the end of the cart, a motion sensor and an air generator. The air generator would circulate air through the air track that similar to a hockey table creating a nearly friction less surface. Wooden blocks and angle measure were also used to raise one side of the air track and determine the angle generated.
Experiment:
Once the apparatus was setup we began to elevate the air track opposite of the magnet side with the wooden blocks. We turned on the air generator causing the cart to move downward toward the magnet and stopping due to the opposing magnetic poles of the cart magnet and track magnet. Once the cart came to a complete stop we measured the distance between the cart and the magnet and measured the angle generating this data sheet:
The next step required us to find the force of gravity acting upon the cart for each angle. In order to find these values we used:
Force = mass * gravity * sin (angle)
After finding the values of the forces we opened logger pro on the laptop and plotted the values on a Force vs. Separation distance graph and created a power fit in order to find the force function and the potential energy of the magnet. As a result the graph below was produced:
Using the values specified by the graph the equation for the force of the magnet was concluded to be:
F(r) = Ar^B
F(r) = (5.57 x 10^-4) * r ^ (-1.64)
By taking the negative integral of the force with respect to the separation distance (r) we calculate the function for the potential energy of the magnet.
U(r) = (8.62 x 10^-4) * r ^ (-0.64)
Now that the potential energy was found we continue to the second part of the experiment which is calculating the kinetic energy.
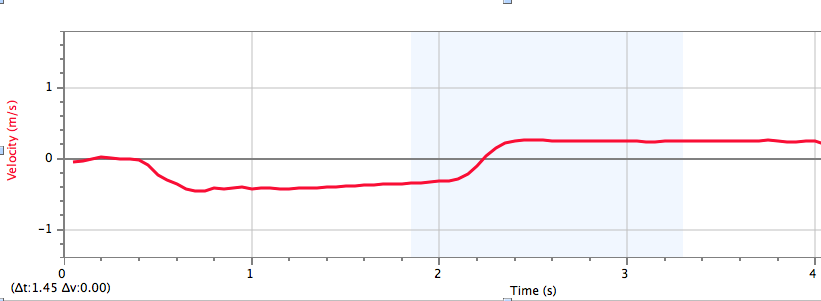
Returning to the air track, we conduct the second part of the experiment by setting up the motion detector and pushing the air track toward the magnet this time on a completely leveled track. The motion detector records the velocity and position of the cart as seen in the graphs below:
Using the values of the velocity graph we can create a kinetic energy vs time graph using the "New Calculated Column" tool on logger pro resulting in:
The lowest point on the graph, or where the kinetic energy is zero, is where the air cart is closest to the magnet.
To prove there is conservation of energy we must add the kinetic and potential energy and they must construct a somewhat horizontal line on a graph
As a result of adding the potential and kinetic energy we generate the graph above.
Conclusion:
Although the total energy graph does not depict a horizontal or consistent line there are various factors that effected the experiment. The air track is not completely friction less causing the decrease in energy as seen in the graph. The graph experiences a major dip when it reaches the magnet but it can be concluded that it is caused by our potential energy function which is not exact since the values are estimated to the thousandths. Once these slight margins of error are dismissed it can be conclude that conservation of energy indeed is verified.


No comments:
Post a Comment