Sunday, November 9, 2014

27-Oct_2014: Conservation of Momentum with collisons

Purpose:
The purpose of this lab was to verify the conservation of momentum in a two dimensional collision by using to equal masses and two different masses.

Apparatus:
The apparatus provided featured a column with a camera attached to the top connected to a laptop. Below it stood a glass table where the collision would take place. Camera captured the collisions as the balls began to move until the wanted data was collected and displayed on logger pro on the laptop. The first collision required two equal mass steel balls while the second collision consisted of one steel ball and a marble of different mass.


Experiment:
Starting with the equal mass collision we placed one of the steel balls in the center of the glass table so that it remained stationary until impact. Once done we took the second steel ball and pushed it toward the stationary ball diagonally creating an impact where the balls resulted in moving in significantly different directions all while recording the collision with the camera placed on the column. Once the video was recorded we saved it on a flash drive to further analyze it and allow our fellow classmates to use the apparatus.

Continuing onto the different mass collision we placed the marble of lesser mass in the center of the glass table so that it remained stationary just as the other ball in the first part of the experiment. Follow the same steps before we took the heavier steel ball and pushed it diagonally towards the stationary marble. Once again we took the recorded video and saved it onto a flash drive for further observation.

After collecting the video recordings we continued to analyze the videos using logger pro by establishing an axis of movement, plotting the position points, and creating a reference distance.
After using the features we were able to generate graphs for the position vs time of the balls as they moved across the glass table.


By taking a linear fit for each position vs time data set, we are able to find the average velocity of each ball before and after the collision in the x and y directions.

Using the velocities recorded by logger pro, the values for momentum of each axis can be solved for using the "Calculated column" tool in logger pro using the definition of momentum:

momentum = mass * velocity

Using all the data up to this point we create the data table shown below:


Further analyzing the total momentum for both experiments we are give the momentum vs time graphs for both the x and y direction.


The graphs appear to be consistent with few dips, meaning that the momentum is conserved throughout the experiment.

Conclusion:
I believe the experiment was successful in proving the conservation of momentum despite the small concavity depicted in  the graphs of momentum. The factor that effected this result consists of human error with inconsistent plotting of point on the collision video as well as the friction experienced by the balls with the glass table.

Saturday, November 8, 2014

20-Oct-2014: Conservation of energy with Elastic and Inelastic cart collsions

Purpose:
The purpose of this lab was to determine the impulse of a cart when it experiences inelastic and elastic collisions.

Apparatus:
The apparatus required three setups and consisted of a cart track, two carts, a force sensor, a motion sensor, clay, and a nail. All the setups required for one cart to be on the track with the force sensor attached to the cart and a motion sensor on the opposing side of the collision as seen below:


The first setup specified that the cart would complete an elastic collision and would collide into another cart while the force sensor recorded the force exerted in the collision and the motion recorded its position as seen below:


The second would require the same actions only with additional mass attached to the colliding cart

The final setup would substitute the stationary cart with a clump of clay which caused the colliding cart to experience an inelastic collision. A nail would be attached to the force sensor in order for the cart to stop when becoming intact with the clay:


Experiment:
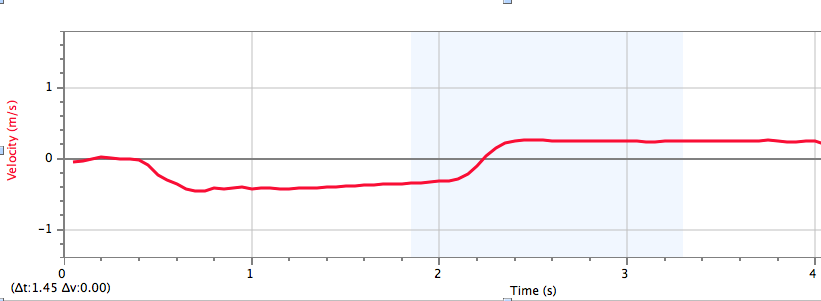
Before performing any of the experiments we first setup the sensors using logger pro on the laptop. Once the sensors were set we proceed to conduct the experiment for the first setup. Here we pushed the cart towards the opposing cart and recorded its velocity, force experienced, and position generating the graph below:


Before analyzing the force vs time we recorded the mass of the cart and determined the change in velocity in order to compare our calculations of the change in momentum with the actual value of the impulse.

momentum = Mass*(velocity final - velocity initial)
ΔP = (0.39 kg)*(-0.406 m/s - 0.452 m/s)
ΔP = -0.3346 Ns

As you can see the cart experienced a spike in force when the velocity changed to negative where the cart impacted the other. By finding the area of the spike in the Force vs. Time graph we determined the impulse that occurred in the elastic collision.

Impulse = -0.3566 Ns

The values of impulse and change in momentum are almost identical.

The experiment for the second experiment was exactly the same with the only change of adding mass the cart. After the experiment once again logger pro generated graphs for force, velocity, and position:


ΔP = (0.89 kg)*(-0.193 m/s - 0.299 m/s)
ΔP = -0.4378 Ns

Impulse = -0.4644

Once again the values of momentum and impulse are similar

Although the velocity of the cart in this experiment is slightly smaller than that of the first experiment the impulse is greater meaning that both mass and velocity have an effect on the impulse.

The final experiment consisted of the same step only substituting the stationary cart with a clump clay resulting in the graph below:


ΔP = (0.39 kg)*(0 m/s - 0.487 m/s)
ΔP = -0.1928 Ns

Impulse = -0.2005

In an inelastic we can see that the values of impulse are much smaller although the velocity is greater.

Conclusion:
After conducting the experiment we can verify that mass and velocity play a big role in determining the value for the change of momentum in an object as well as the force and time that effect impulse.

13-Oct-2014: Potential Energy of Air cart and magnet

Purpose:
The purpose of this lab was to find a power fit function for the potential energy of an air track magnet and verifying conservation of energy.

Apparatus:
The apparatus consisted of an air track with a magnet attached to its end, an air cart with a magnet attached to the end of the cart, a motion sensor and an air generator. The air generator would circulate air through the air track that similar to a hockey table creating a nearly friction less surface. Wooden blocks and angle measure were also used to raise one side of the air track and determine the angle generated.


Experiment:
Once the apparatus was setup we began to elevate the air track opposite of the magnet side with the wooden blocks. We turned on the air generator causing the cart to move downward toward the magnet and stopping due to the opposing magnetic poles of the cart magnet and track magnet. Once the cart came to a complete stop we measured the distance between the cart and the magnet and measured the angle generating this data sheet:


The next step required us to find the force of gravity acting upon the cart for each angle. In order to find these values we used:

Force = mass * gravity * sin (angle)

After finding the values of the forces we opened logger pro on the laptop and plotted the values on a Force vs. Separation distance graph and created a power fit in order to find the force function and the potential energy of the magnet. As a result the graph below was produced:

Using the values specified by the graph the equation for the force of the magnet was concluded to be:

F(r) = Ar^B
F(r) = (5.57 x 10^-4) * r ^ (-1.64)

By taking the negative integral of the force with respect to the separation distance (r) we calculate the function for the potential energy of the magnet.

U(r) = (8.62 x 10^-4) * r ^ (-0.64)

Now that the potential energy was found we continue to the second part of the experiment which is calculating the kinetic energy.

Returning to the air track, we conduct the second part of the experiment by setting up the motion detector and pushing the air track toward the magnet this time on a completely leveled track. The motion detector records the velocity and position of the cart as seen in the graphs below:


Using the values of the velocity graph we can create a kinetic energy vs time graph using the "New Calculated Column" tool on logger pro resulting in:


The lowest point on the graph, or where the kinetic energy is zero, is where the air cart is closest to the magnet.

To prove there is conservation of energy we must add the kinetic and potential energy and they must construct a somewhat horizontal line on a graph


As a result of adding the potential and kinetic energy we generate the graph above.

Conclusion:
Although the total energy graph does not depict a horizontal or consistent line there are various factors that effected the experiment. The air track is not completely friction less causing the decrease in energy as seen in the graph. The graph experiences a major dip when it reaches the magnet but it can be concluded that it is caused by our potential energy function which is not exact since the values are estimated to the thousandths. Once these slight margins of error are dismissed it can be conclude that conservation of energy indeed is verified.

1-Oct-2014: Potential Energy of Spring cart

Purpose:
The purpose of this lab was to determine the relationship between the work and change in kinetic energy of a cart attached to a spring.

Apparatus:
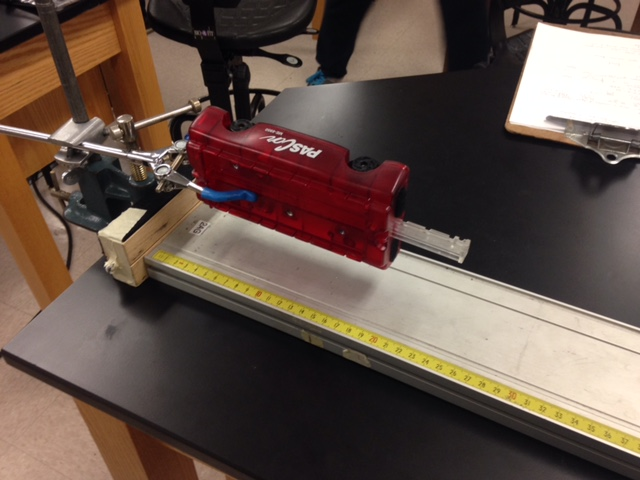
The apparatus, as pictured below, consists of a track, a cart, a spring, a motion sensor, and a force sensor. Two wooden blocks were added onto the cart in order to increases its mass, also another wooden block was placed under the spring to increase the data's accuracy.


Experiment:
In order to begin the experiment we first had to open logger pro on the laptop and setup the force and motion sensors so that the data could be digitally recorded on the program. Once completed we proceeded to conduct the actual experiment by moving the cart a good distance so that the spring was extended to an effective length. An effective length would be one that could record a decent change in the potential energy of the spring without causing the cart to accelerate at a speed that could cause the data to be unreliable and/or damage the apparatus when the cart is released. Once found the cart was then stretched to that position and let go. As a result a force vs. position graph was constructed by logger pro depicting the amount of force experience at each position.

The next step requires the construction of a kinetic energy vs position graph using the data recorded by logger pro. By creating a "New Calculated Column" and using the data recorded, the computer was able to compute values for kinetic energy:

KE = 1/2 * mass * velocity^2


Once the two graphs were constructed we proceeded to determine the relationship between the work done and the amount of kinetic energy at each position. By finding the area of the work graph between two defined position point we were able to find the total amount of work done from one point to another. We compared these values with the amount of kinetic energy at each point and observed that the values were very similar


Conclusion:
As seen in the graphs above our values for work and kinetic energy are slightly off but there are entities that can effect the values retrieved from this experiment the first being the looseness spring which caused a friction effect between it and the wooden placed below it. Second are our values for the mass of the cart because we do not have and exact value, only an estimated one which can slightly effect our value for kinetic energy. Disregarding the errors it is clear that the work done by is system is equal to the kinetic energy it sustains.

29-Sept-2014: Determining Work with different masses (stairs & pulley)

Purpose:
The purpose of this lab was to determine the work and power generated by walking up a set of stairs and pulling a mass upward roughly the same distance.

Apparatus:
The apparatus were the stairs located on the north side of the Science building 60 as well as the second floor balcony where a pulley was placed with a mass suspended by rope.


Experiment:
The first step of the lab was to record the distances that would be traveled up the stairs by the student and up the balcony by the pulley. We recorded 26 steps up the stairs each measuring 16.5 centimeters in height which resulted in a distance of 4.29 meters that were being traveled from the bottom of the stairs to the top. Once the distance was determined we conducted the experiment by first travelling up the stairs at slow pace then a faster pace and recording the duration of the trip. Once we collected all of the necessary data we followed to next experiment of the pulley and mass.

Just as the previous experiment we recorded the distance traveled but in this case it was from the floor to the balcony railing and using a mass as seen in the apparatus. Using a 3 meter stick we recorded the distance as 5.3 meters. Following the distance collection we proceeded to conduct the experiment by pulling the mass upward and recorded the time taken to reach the top and the amount of the mass.

After collecting all the data we continued back inside in order to calculate the work and power

Here is the data used:

Stairs
  • Mass = 180 lb. = 81.8 kg.
  • Distance = 4.29 m
  • Time 1 = 13.14 s
  • Time 2 = 6.6 s
Pulley
  • Mass = 6 kg
  • Distance = 5.3 m
  • Time = 5.6 s
Calculations:

Using the definition of work: Work = Force x Distance we determined how much work was done to travel up the stairs:

Work = (81.8 kg) * (9.81 m/s^2) * (4.29 m)
Work = 3442.5 Joules

Now for power we used: Power = Work / Time to determine the power generated from strolling up the stairs to running up the stairs:

Power = (3443.5 J) / (13.14 s)
Power = 261.9 watts

Power = (3443.5 J) / (6.6 s)
Power = 521.6 watts

Next we calculated the values of work and power for the pulley system:
Work = (6 kg) * (9.81 m/s^2) * (5.3 m)
Work = 311.9 Joules

Power = (311.9 J) / (5.6 s)
Power = 55.7 watts

Conclusion:

After solving for the values of work and power for each experiment i can be concluded that traveling up the stairs is more effective at burning calories than that of the pulley system.